Originally posted at Serverless on September 12th, 2019
One of the most popular features of the Serverless Framework is its ability to provide monitoring with automatic instrumentation. By signing up for a free Serverless Framework account and deploying your service, it is automatically instrumented to capture all of the data needed to provide metrics, alerts, notifications, stacktraces and more.
This is especially powerful when it comes to monitoring and debugging errors. When your code throws an error, then the Serverless Framework provides a few ways to monitor and debug those errors:
You will get a New Error Type alert for your service instance, notifying you in Slack or Email that a new error was identified.
The stack trace is captured and in the Serverless Dashboard you can see the stack trace highlighting the exact line which threw the error.
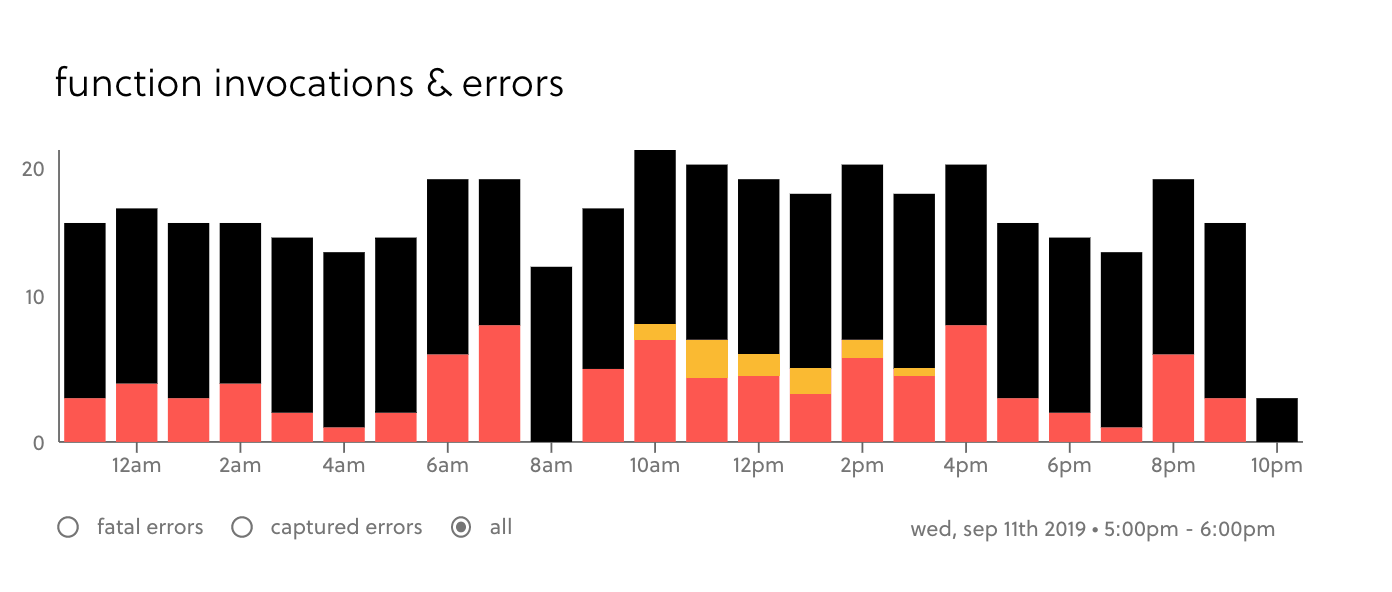
The invocations & errors chart will show you the number of times errors have occurred over a span of time.
Using the invocation explorer you can search and identify the individual invocations which got the error and dig into all the details.
No wonder this is such a popular feature.
However, until today, capturing the errors only worked for cases where the error was not caught by the code and resulted in a fatal crash of the Lambda invocation. But of course we do not want our services to return 500 in such cases, so more often than not, the errors are caught and the Lambda function returns a nicer 4XX error.
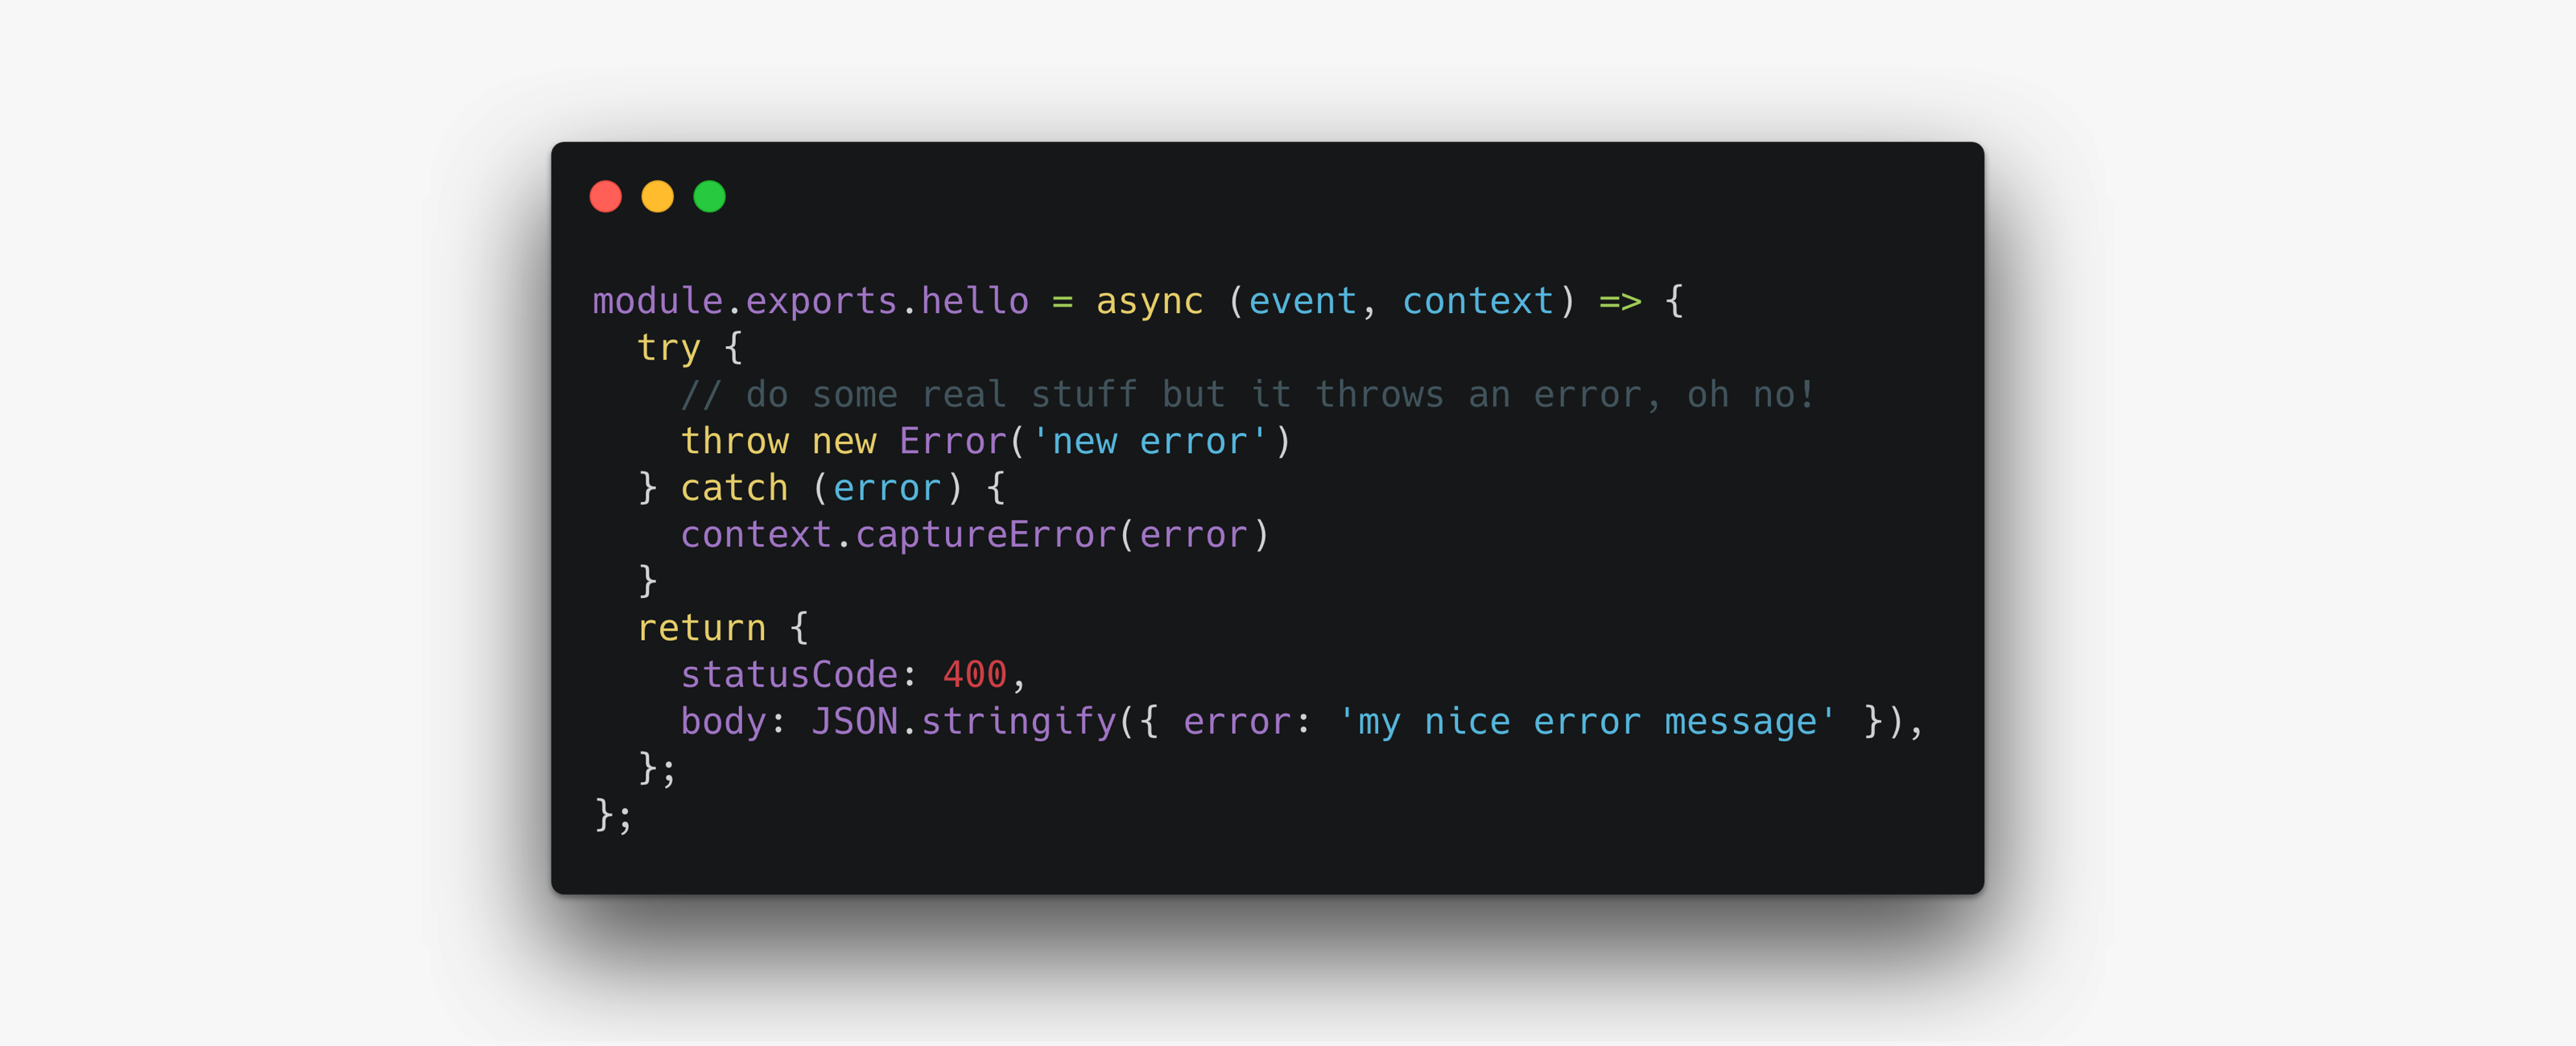
Today we are launching a new addition to the Serverless Framework to help capture errors even when they are caught by your code. So let’s look at this code first.
In the example above, our lambda function handler throws an error; however, it is also caught. It calls the captureError function provided by the Serverless Framework SDK in the context object. The function was able to proceed and return a nice friendly error to the API while still capturing the error. The documentation provides more details on using the captureError method.
Now that the error is captured by the Serverless Framework, you can use the powerful dashboard features to help monitor and debug these errors. Here are a few ways you can interact with these newly captured errors in the dashboard.
When a new error is captured which hasn’t been captured before, you will get a New Error Type alert. You can also setup notifications to get notified in Slack or email, or custom SNS Topics or API endpoints.
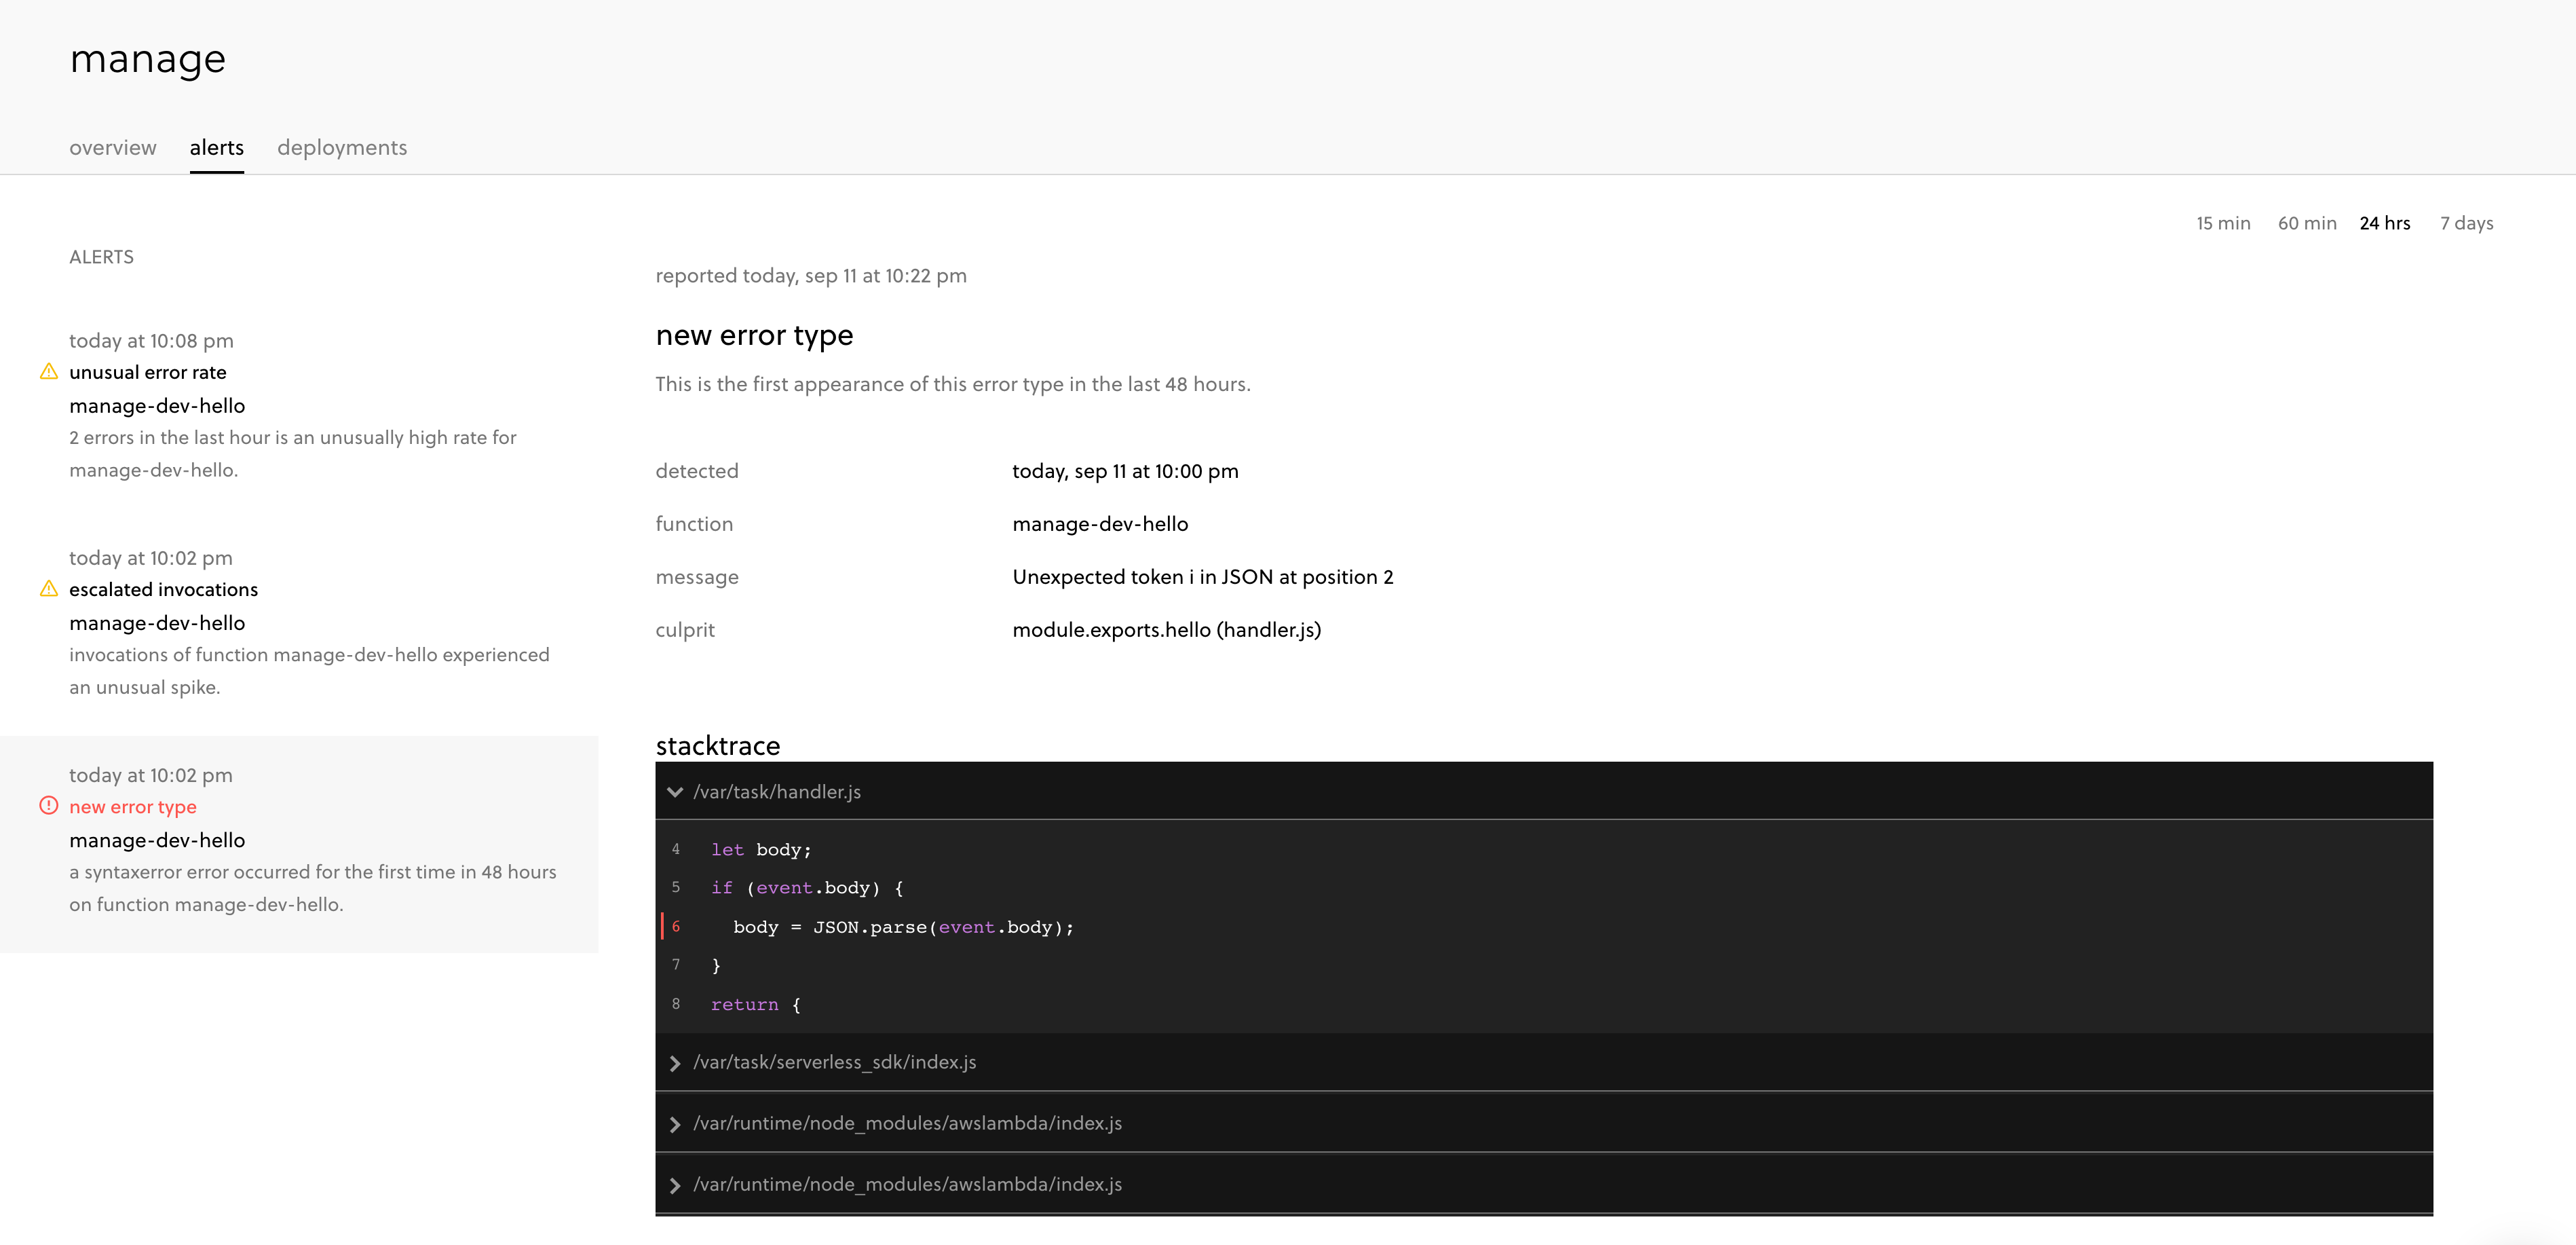
All errors, including fatal errors and captured errors, are available in the Invocation Explorer so you can filter for invocations containing errors.
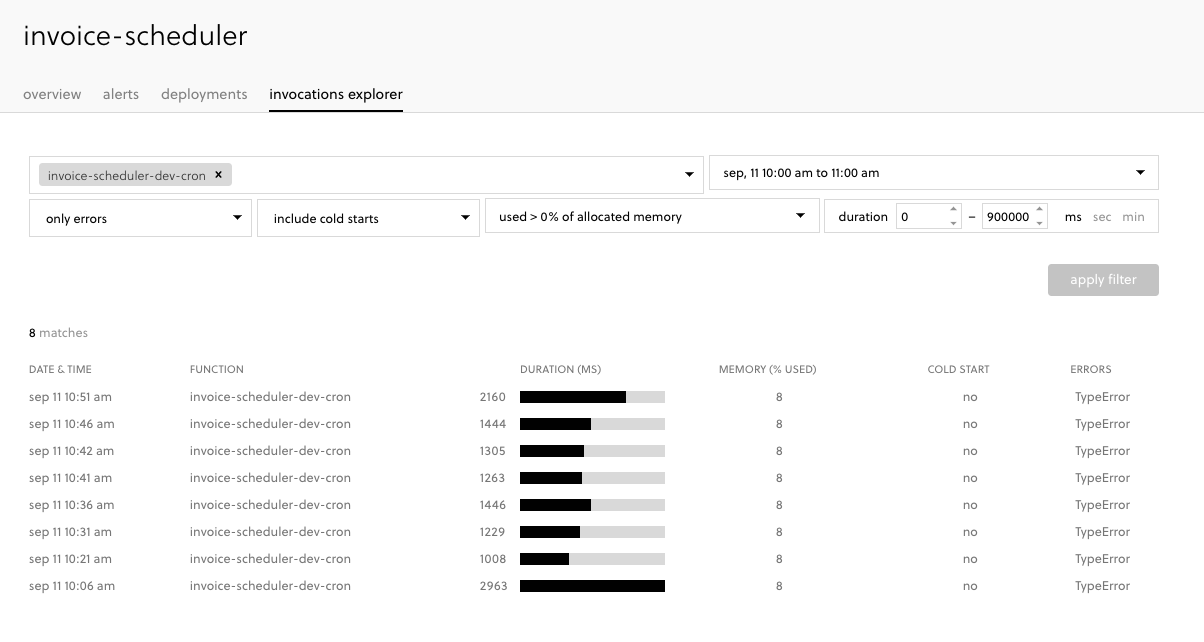
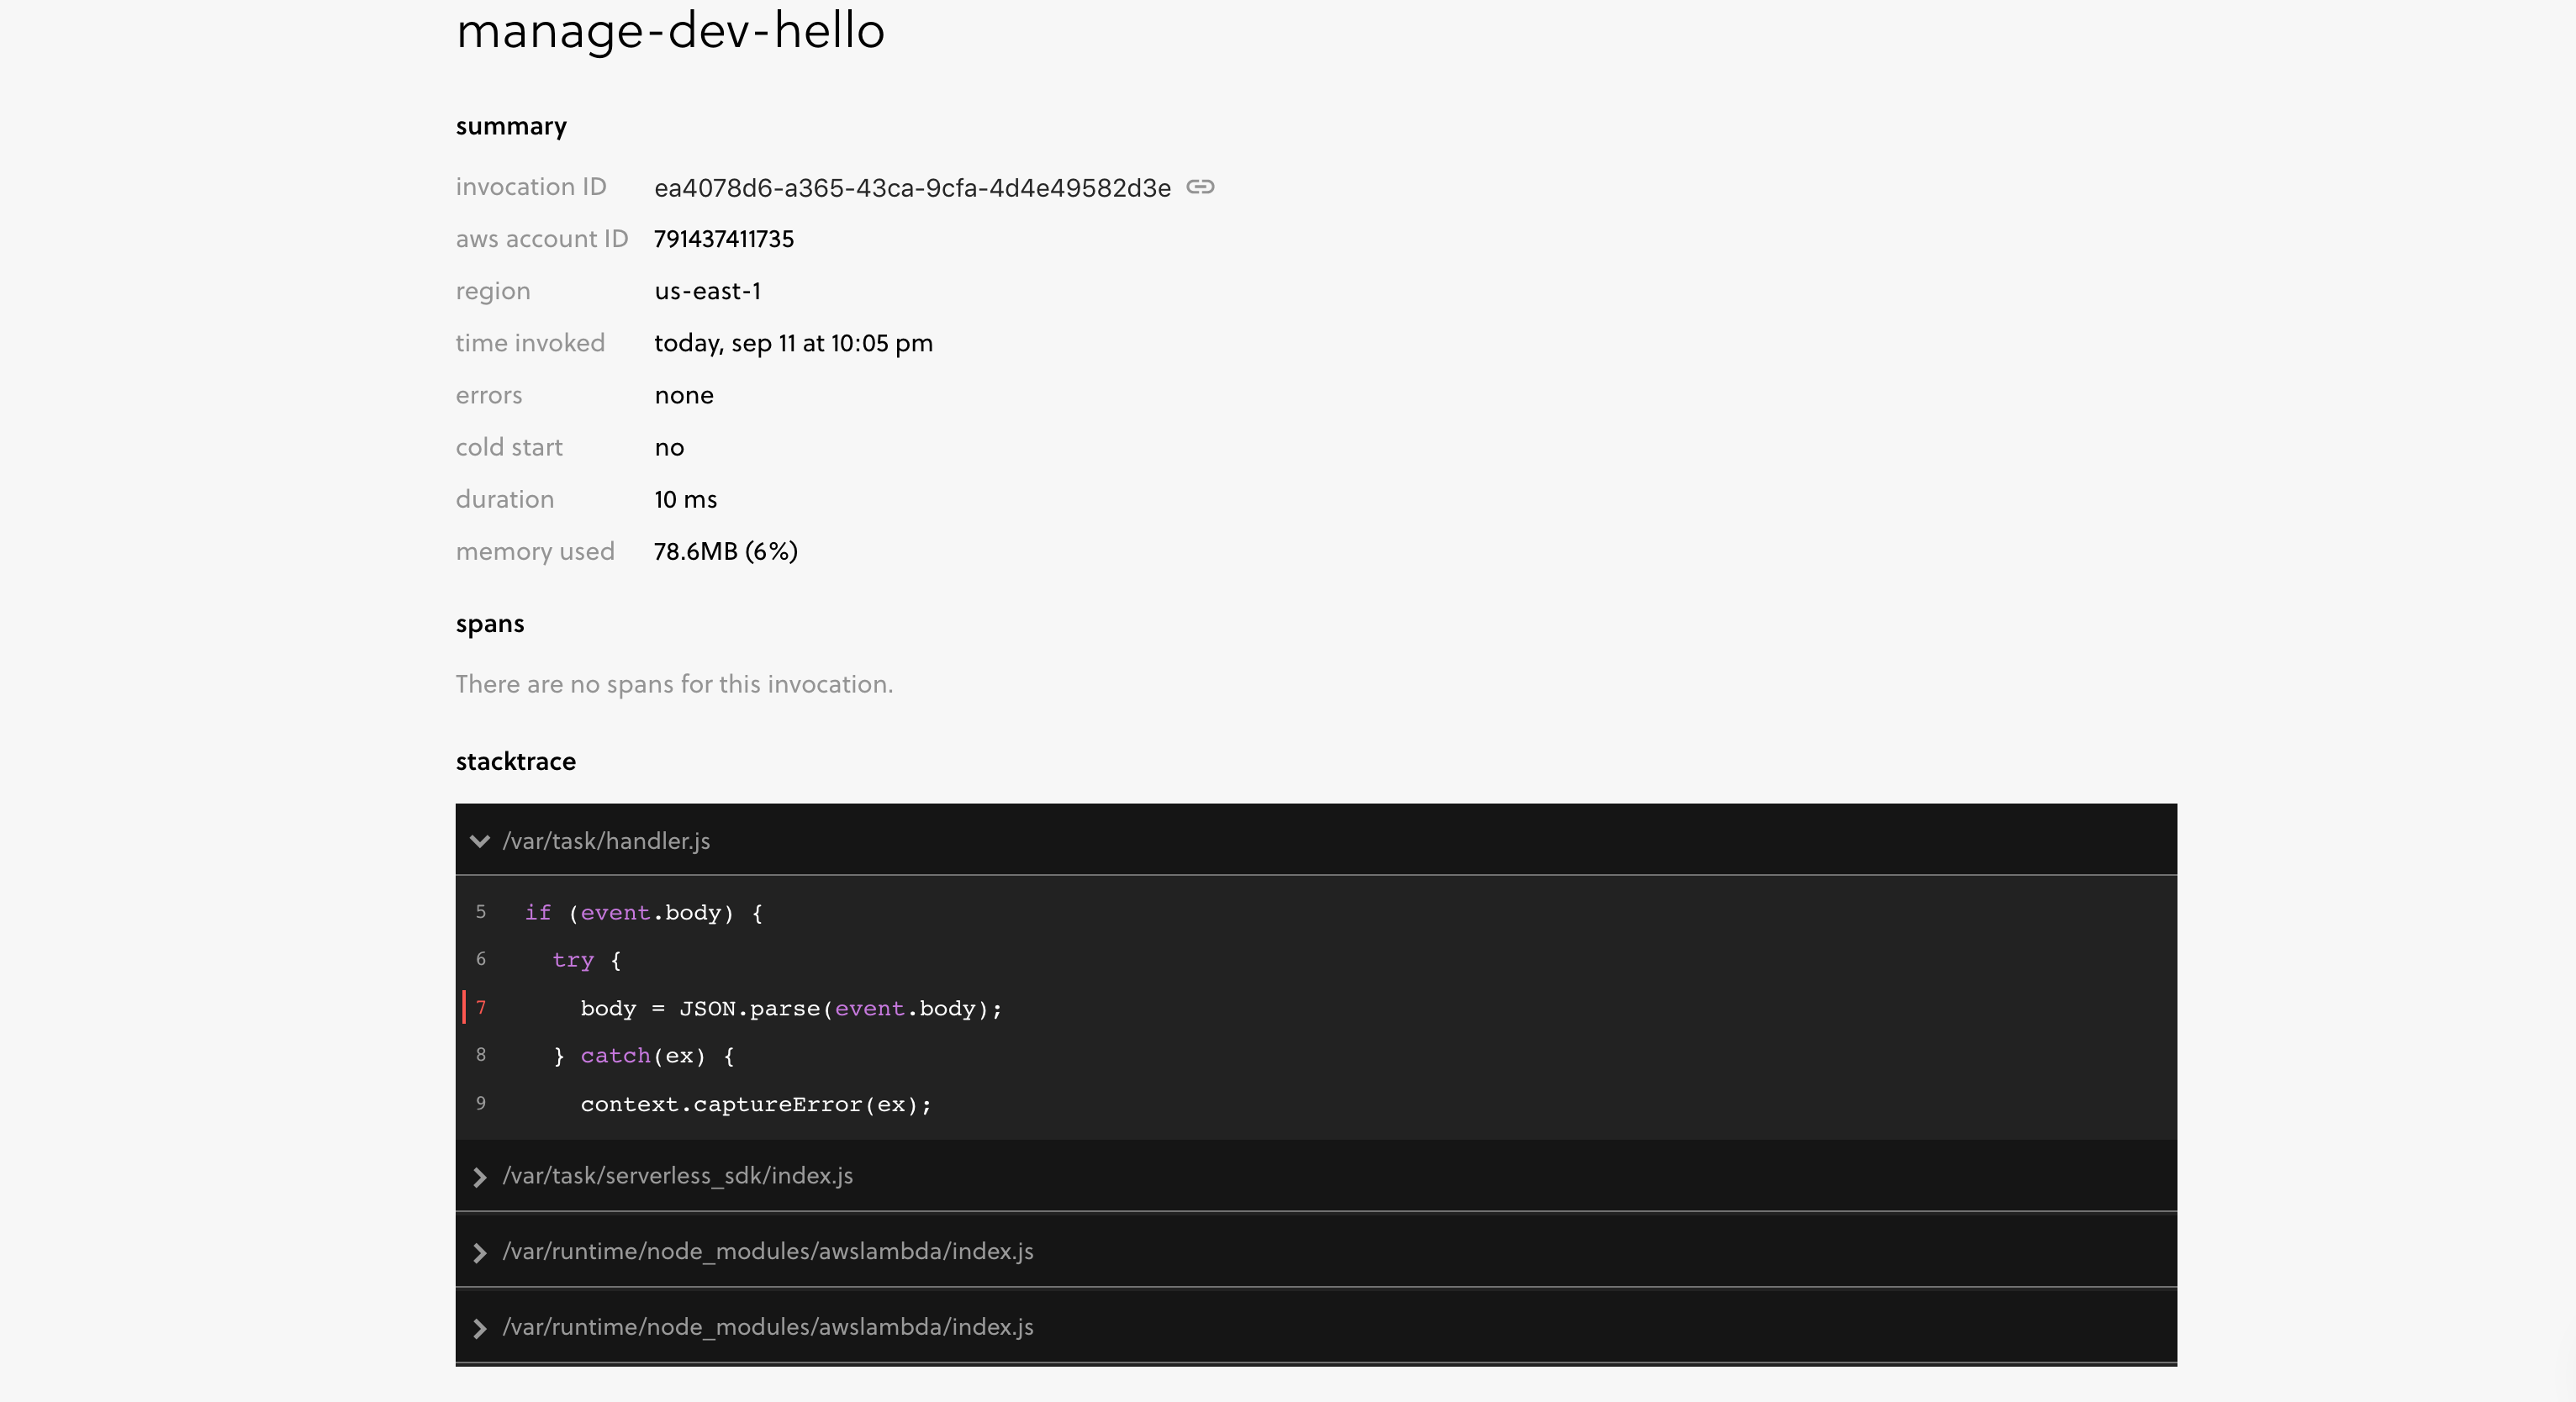
Also in the invocation explorer you can dive into the details of the individual invocation to get the details about the error, including the stack trace which was captured by the captureError method in the code.
Lastly, in the service instance overview page you can view invocation metrics and filter the results to identify the captured errors.
If you want to improve monitoring and debugging for your Serverless Framework application, getting started with the automatic instrumentation is incredibly easy. Sign up in the dashboard and follow the instructions to start a new Serverless Framework project or incorporate the dashboard features into existing services.
Originally published at https://www.serverless.com.

